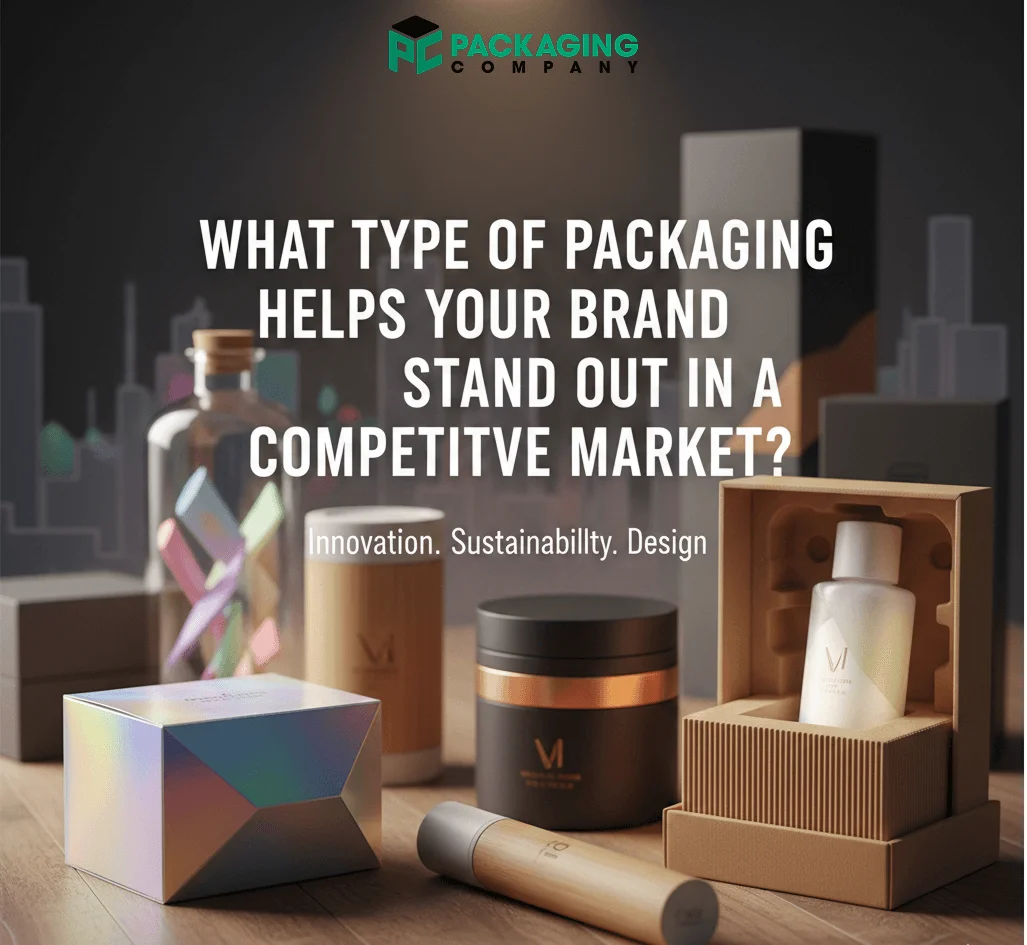
Packaging design helps buyers choose fast in stores and online. Clear labels reduce confusion and returns. Knowing What Type Of Packaging is useful for you. Depending on the product, the channel, and the brand objectives, it performs most effectively. The American packaging sector expands annually. Millions of items leave stores, online stores, and companies every day.
Good designs, strong boxes, and clear labels make sure that these things get from the factory to your home safely. In 2030, the U.S. packaging industry could be worth $250 billion; currently it is worth about $210 billion. Health goods, food delivery, and internet buying drive this rise. Price, safety, and environmentally friendly packaging are all appreciated by customers. Shops give speed, shelf space, and few returns top priority.
What Type Of Packaging is Ideal for Brands: Primary, Secondary or Tertiary Packaging
Teams ask one big question: What Type Of Packaging works best for products and buyers? The answer depends on the role. Primary packaging touches the product and builds the first impression.
Secondary packaging groups several units together for storage and shipping. Tertiary packaging secures large loads for trucks and pallets. Each layer adds cost but also adds value. Smart choices cut waste, guard goods, and boost sales. Sustainable packaging builds trust and loyalty.
1. Primary packaging: The first layer of protection
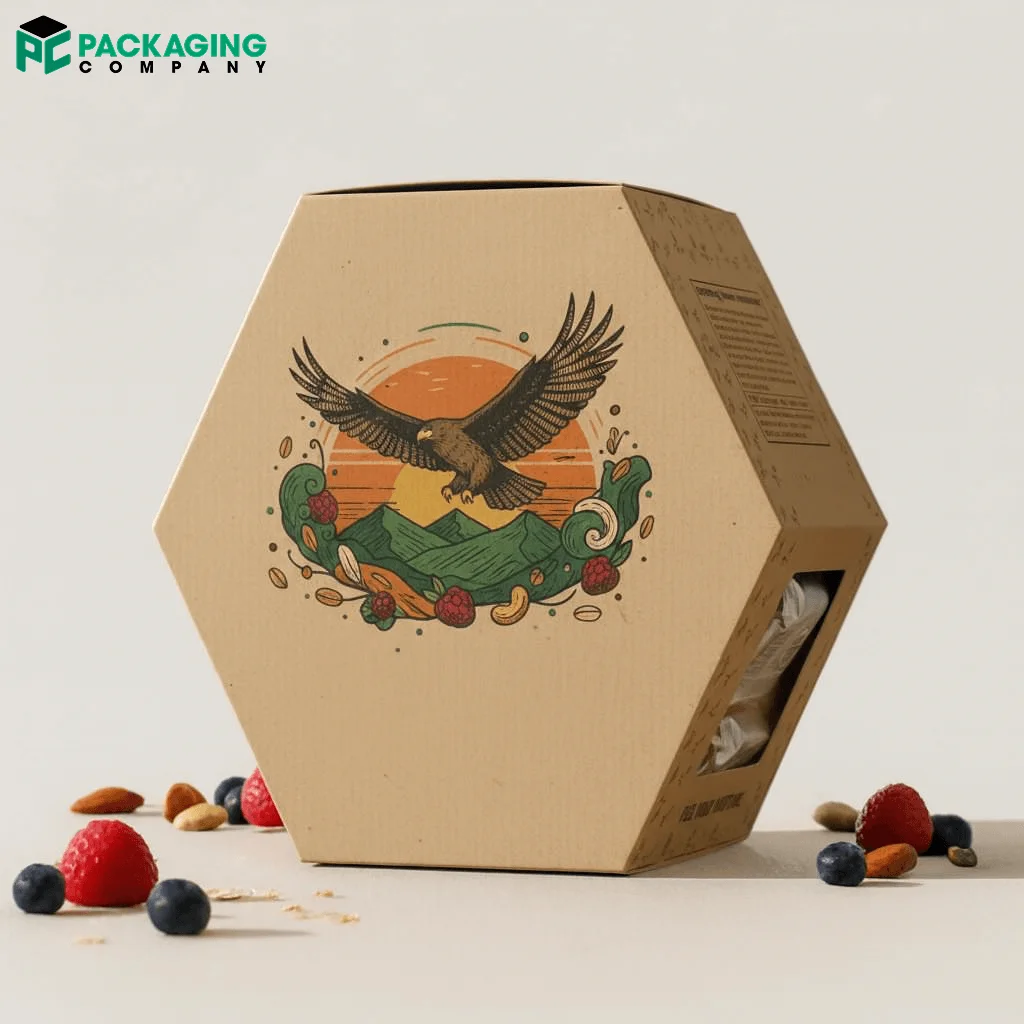
It interacts with the product immediately. It shields beverages, cosmetics, pills, and food from air, heat, and moisture. Also, it highlights the brand promise, figures, and guidance. Depending on the product, teams employ glass bottles, plastic pouches, metal cans, paper cartons, or bio films.
Size and shape matter because buyers care about grip, pour, open, and reseal. Strong seals stop leaks. Clear labels build trust. Custom Food packaging design here drives shelf appeal and online clicks.
- Market share: Food and drinks take 50% of primary packaging in the U.S.
- Plastic share: Plastics hold 35%–40% of primary packaging volume.
- Glass role: Glass bottles keep 20% share in premium drinks.
- Paper cartons: Millions of cereal and milk cartons sell weekly.
- Cost range: Primary packaging adds 5%–12% to product cost.
- Leak cut: Strong seals reduce leaks by 30%–50%.
- Shelf life: Barrier films extend shelf life by 20%–60%.
Primary packaging comparison
|
Type |
Common uses |
Strengths |
Limits |
|---|---|---|---|
|
Plastic |
Snacks, shampoo |
Light, cheap, flexible |
Waste, low recycle rate |
|
Glass |
Drinks, sauces |
Pure, premium feel |
Heavy, break risk |
|
Metal |
Cans, aerosols |
Strong, long shelf life |
Cost, dent risk |
|
Paperboard |
Cartons, sleeves |
Renewable, printable |
Moisture limits |
|
Bio films |
Produce, liners |
Compostable, lower carbon |
Heat limits |
2. Secondary packaging: Grouping products together
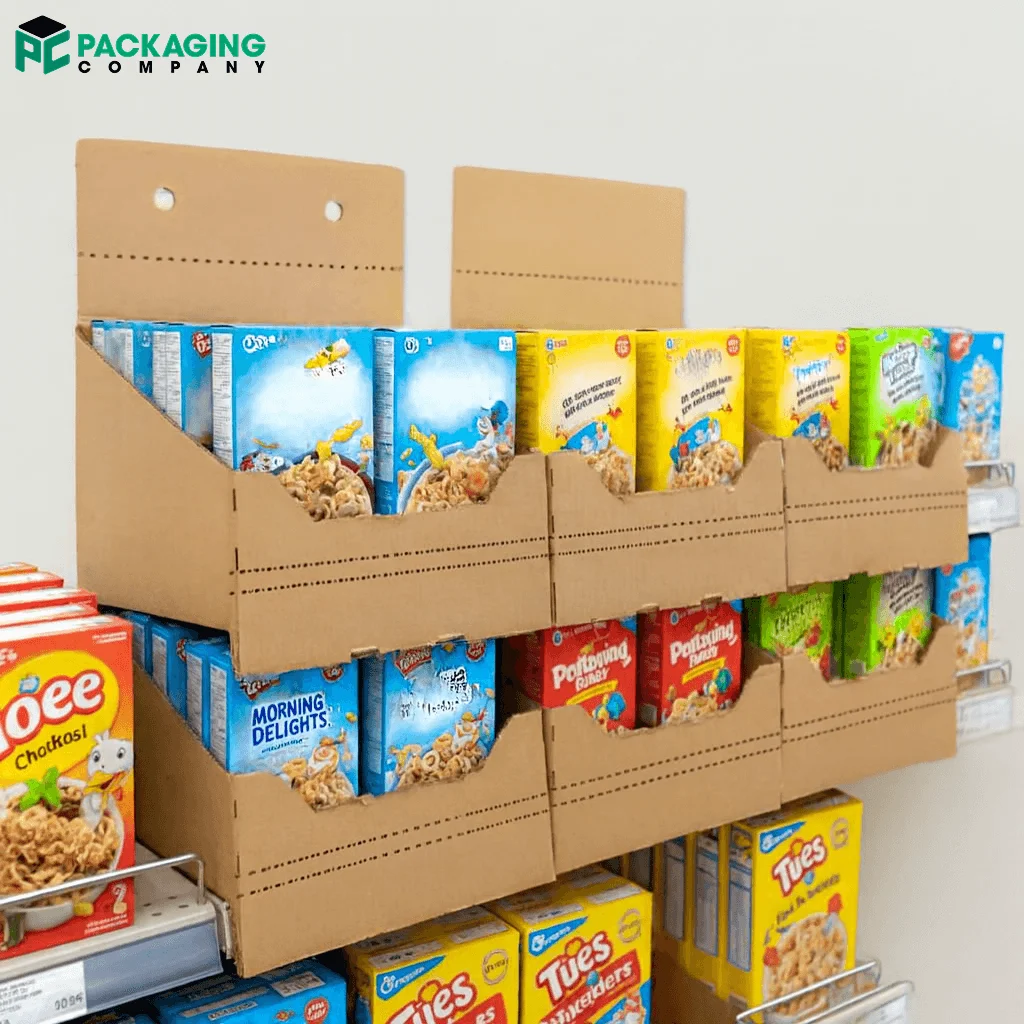
Many units of primary packing are found in its packaging. Storage and shipping are facilitated by corrugated boxes, cartons, trays, and shrink bundles. This level has a lot of numbers, taste codes, and barcodes.
Online shopping pushes more secondary packaging into homes. Corrugated boxes lead because they are strong and easy to print. Right-size boxes cut empty air and lower freight costs. Shelf ready packaging speeds stocking in stores. Protective packaging reduces breakage.
- Online push: Online sales near $1 trillion drive box demand.
- Corrugated share: Boxes cover 60% of secondary packaging.
- Damage drop: Fit-to-size boxes reduce breakage by 20%–35%.
- Speed gains: Shelf-ready trays cut stocking time by 25%–40%.
- Cost share: Secondary packaging adds 3%–8% to product cost.
- Space use: Right-size designs lift pallet fill by 10%–25%.
- Returns cut: Strong edges lower returns by 15%–25%.
Secondary packaging optimization
|
Feature |
Benefit |
Improvement |
|---|---|---|
|
Right-size boxes |
Less empty space |
10%–25% freight cut |
|
Shelf-ready trays |
Faster shelf load |
25%–40% labor cut |
|
Strong corners |
Fewer dents |
15%–25% damage cut |
|
Clear labels |
Faster picking |
10%–20% time saved |
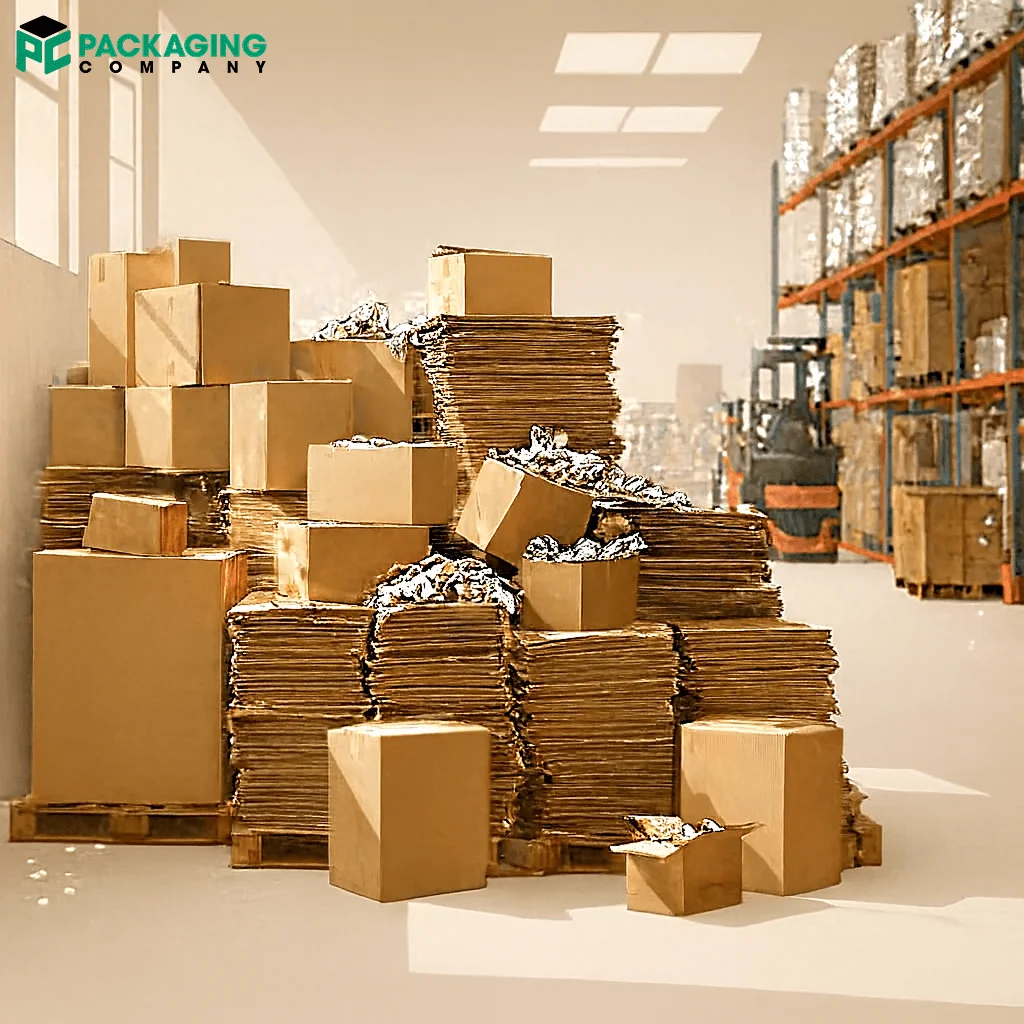
3. Tertiary packaging: Bulk handling and transport
It secures bulk loads for trucks, ships, and warehouses. Pallets, stretch film, straps, and corner guards hold stacks together. This layer faces forklifts and long trips. Pallet patterns guide stack strength.
The 48×40 pallet fits most U.S. networks. Sensors track shock and tilt for fragile goods. Strong loads cut worker injury and product loss. Cold chain packaging uses insulated shippers and data loggers to protect food and drugs.
- Freight scale: U.S. freight moves billions of tons yearly.
- Pallet use: Standard 48×40 pallets fit most networks.
- Load security: Stretch film cuts shifts by 40%–60%.
- Labor savings: Stable loads trim handling time by 15%–30%.
- Film weight: Right gauge film drops wrap use by 20%–35%.
- Stack rule: Safe height stays near 60–72 inches.
- Damage cut: Corner guards reduce crush by 20%–30%.
Tertiary packaging performance
|
Element |
Purpose |
Gain |
|---|---|---|
|
Stretch film |
Hold stacks |
40%–60% fewer shifts |
|
Strapping |
Add strength |
20%–30% less crush |
|
Pallet layout |
Stability, airflow |
10%–20% faster flow |
|
Corner guards |
Edge protection |
20%–30% damage cut |
4. Sustainability in packaging
Sustainable packaging matters more each year. Buyers want less waste and more recycled content. Paper and cardboard recycle well. Plastics recycle less but improve with clear resin marks. Compostable and bio-based packs grow in use.
Right-size boxes cut fuel and air. Refill systems reduce single-use plastic. Fewer parts help sorting. Clear marks guide buyers at home. Eco friendly packaging builds trust and loyalty.
- Shopper demand: 70%–75% prefer sustainable packaging.
- Paper recycle: Paper recycling rates near 65%–70%.
- Plastic recycle: Plastic recycling stays near 9%–12%.
- Weight cut: Light packs trim fuel by 5%–15%.
- Refill gains: Refill models reduce plastic by 30%–60%.
- Ink shift: Water-based inks cut VOCs by 50%–80%.
- Design wins: Fewer parts lift sort rates by 10%–25%.
How to Plan Sustainable Packaging
|
Action |
Waste impact |
Cost impact |
|---|---|---|
|
Recycled content |
Less virgin material |
2%–5% cost change |
|
Right-size design |
Less air and wrap |
10%–25% freight cut |
|
Refill systems |
Less single-use |
15%–30% savings |
|
Clear labels |
Better sorting |
Lower fees |
5. Packaging and branding
Packaging sells before words. Shape, color, and texture guide choices. Clean panels show promises and facts. Premium finishes like matte, foil, and embossing build value. Bright colors raise shelf pop. Earth tones show natural lines.
QR codes link to videos and rewards. Unboxing experience adds joy and loyalty. Brand storytelling thrives when packaging design supports claims and makes use easy.
- Design impact: 70%–75% say packaging shapes choice.
- Shelf pop: High contrast colors lift notice by 25%–35%.
6. Smart packaging technology
Smart packaging adds safety, data, and trust. Sensors track heat, shock, and freshness. RFID labels help count and locate items quickly. Time-temperature indicators show if cold chains break. Anti-tamper seals protect baby food and medicine. Dynamic QR codes support lot trace and recall checks.
NFC chips allow loyalty rewards and reorders with a tap. Smart packaging helps to build trust, hasten supply chains, and minimize errors. From cuisine to pharmaceuticals, time temperature indicators, anti-tamper seals and RFID tags have become common in several industries.
- Market size: Smart packaging value sits near $10 billion in the U.S.
- Error drop: RFID lowers pick and ship errors by 30%–40%.
- Cold chain: Sensors protect hundreds of billions in food and drug value.
- Recall speed: Track and trace cuts recall time by 40%–60%.
- Shrink cut: Active seals reduce theft by 10%–20%.
- Data gain: Unit-level data lifts forecast accuracy by 10%–25%.
- Cost trade: Smart tags add $0.01–$0.10 per unit.
|
Tech |
Use case |
Benefit |
|---|---|---|
|
RFID labels |
Inventory tracking |
30%–40% error cut |
|
TTIs |
Cold chain monitoring |
Faster spoilage detection |
|
NFC chips |
Loyalty and reorders |
Higher repeat actions |
|
Tamper seals |
Safety and trust |
10%–20% shrink cut |
7. Cost efficiency in packaging
Cost efficiency matters for every brand. Teams balance safety, speed, and savings. Light materials lower freight and fuel. Right-size boxes cut waste and damage. Simple shapes reduce line changeover time. Standard parts lower buy costs. Reusable totes and pallets save money in B2B loops. Clear specs reduce supplier mistakes. Drop, crush, and seal tests catch problems early.
Smart plans consider the entire landed cost: labor, freight, returns, and disposal; materials. Usually the ideal combination of cost and safety comes from flexible packaging and corrugated boxes. Reusable packaging adds savings in long supply chains.
- Cost share: Packaging makes up 8%–15% of unit cost.
- Weight savings: Flexible packs cut ship weight by 20%–35%.
- Freight savings: Right-size boxes lower freight spend by 10%–25%.
- Reuse wins: Reusable totes save $50–$200 per lane each quarter.
- Line speed: Easy-seal designs lift line speed by 10%–20%.
- Return cuts: Better protection lowers returns by 15%–30%.
- Waste fees: Less waste reduces disposal fees by 10%–25%.
|
Lever |
Area impacted |
Savings |
|---|---|---|
|
Material switch |
Unit cost, freight |
10%–20% per unit |
|
Right-size design |
Freight, damage |
10%–25% total shipped |
|
Standardization |
Buy price, setup |
5%–15% component cost |
|
Reuse systems |
B2B loops |
$50–$200 per quarter |
8. Future trends in packaging
Future packaging trends point to greener materials and smarter data. Recycled content grows as supply chains improve. Compostable options expand with better standards. Digital links on packs guide buyers to care tips and rewards. Augmented reality packaging may turn packs into guides and games. On-demand lines print boxes in minutes for small runs.
Retail shifts toward shelf-ready cases to reduce labor. Data helps teams measure leaks and plan fixes. Policy pushes clear recycling labels and trace tools. The aim stays simple: safe goods, low waste, fair cost, and smooth buyer paths. What Type Of Packaging will evolve with tech, rules, and shopper needs.
- Recycled growth: Recycled input could reach 40%–50% by 2030.
- AR growth: Augmented content grows 15%–25% yearly.
- Bio share: Bio plastics hold 10%–15% share by 2030.
- On-demand: Local box making cuts lead times by 50%–80%.
- Policy push: Clear sort marks lift recycle rates by 10%–20%.
- Data use: Pack data reduces out-of-stocks by 10%–15%.
- Energy cut: Lighter packs lower energy by 5%–12%.
|
Trend |
Effect area |
Impact |
|---|---|---|
|
Recycled content |
Material footprint |
40%–50% by 2030 |
|
AR experiences |
Shopper engagement |
15%–25% growth |
|
On-demand boxes |
Lead times |
50%–80% faster |
|
Clear sort marks |
Recycling at home |
10%–20% rate lift |

What Type Of Packaging Works Best | Ask Experts
Understanding What kind Of Packaging sets the path for cost, safety, and trust. Primary packaging protects and sells with strong seals and clear facts. Secondary packaging groups and speeds with right-size boxes and shelf-ready trays. Tertiary packaging moves and secures with tight wraps, strong straps, and safe stacks.
Simple designs cut waste, save money, and boost sales. Clear marks help buyers recycle at home. Smart packaging adds data and safety for sensitive goods. No matter What Type Of Packaging you need, Packaging Company can serve you well in this regard.
FAQs
What is primary packaging?
It touches the product and guards it. Bottles, cans, wrappers, and blister packs count as primary.
- Common types: Bottles, tubes, jars, cans, pouches.
- Key jobs: Protect, inform, sell.
- Cost share: 5%–12% of unit cost.
What is secondary packaging?
It groups several units for storage and shipping. Cartons, trays, and corrugated boxes help picking and stacking.
- Retail gains: Shelf-ready trays cut labor by 25%–40%.
- Ship gains: Right-size boxes reduce damage by 20%–35%.
- Space gains: Layout raises pallet fill by 10%–25%.
What is tertiary packaging?
Tertiary packaging secures bulk loads on pallets and crates. Stretch film, straps, and guards lock stacks.
- Stability: Stretch wrap drops shifts by 40%–60%.
- Height: Safe stacks stay near 60–72 inches.
- Damage: Guards cut crush by 20%–30%.
What share does flexible packaging hold?
Flexible packaging holds 20%–25% of the market.
- Weight cut: Flexible packs trim weight by 20%–35%.
- Freight cut: Saves 10%–25% freight.
- Shelf life: Adds 20%–60% life.
What share of paper packaging gets recycled?
Paper recycling rates sit near 65%–70%.
- Label help: Marks lift rates by 10%–20%.
- Rate band: 65%–70% recycle rates for paper and cardboard.
- Fiber life: Paper fibers recycle 5–7 times before breaking.